SurplusInterconnectionin Virginia
Accelerating Clean Energy Deployment by Leveraging Existing Grid Infrastructure
Virginia's clean energy transition faces critical interconnection bottlenecks despite ambitious goals
The Problem
Data Center Demand Surge
Data centers drive 87% of Dominion's projected load growth, with demand expected to double by 2039. Northern Virginia is the world's largest data center market, but extended interconnection timelines (6+ years average) limit competitiveness for these high-value investments seeking speed-to-power.
Gridlock in Interconnection Queues
Virginia has ~8 GW of projects in PJM interconnection queue (Dominion zone), with average wait times exceeding 6 years—Active projects average 6.2 years in queue, while projects Under Construction have waited 7.4 years on average.
Skyrocketing Capacity Prices
Capacity market prices have surged dramatically: PJM Dominion Zone hit $444.26/MW-day for 2025/26 (65% above RTO average), and 2026/27 reached the price cap at $329.17/MW-day (11.4× increase from 2024/25 baseline of $28.92/MW-day).
Gas Plant Supply Chain Constraints
New gas plants ordered today won't come online until 2030-2031 at earliest, with capital costs surging from $1,116-1,427/kW to over $2,000/kW for recent combined-cycle projects (GridLab, 2025).
The Solution: Surplus Interconnection
Surplus Interconnection for Virginia
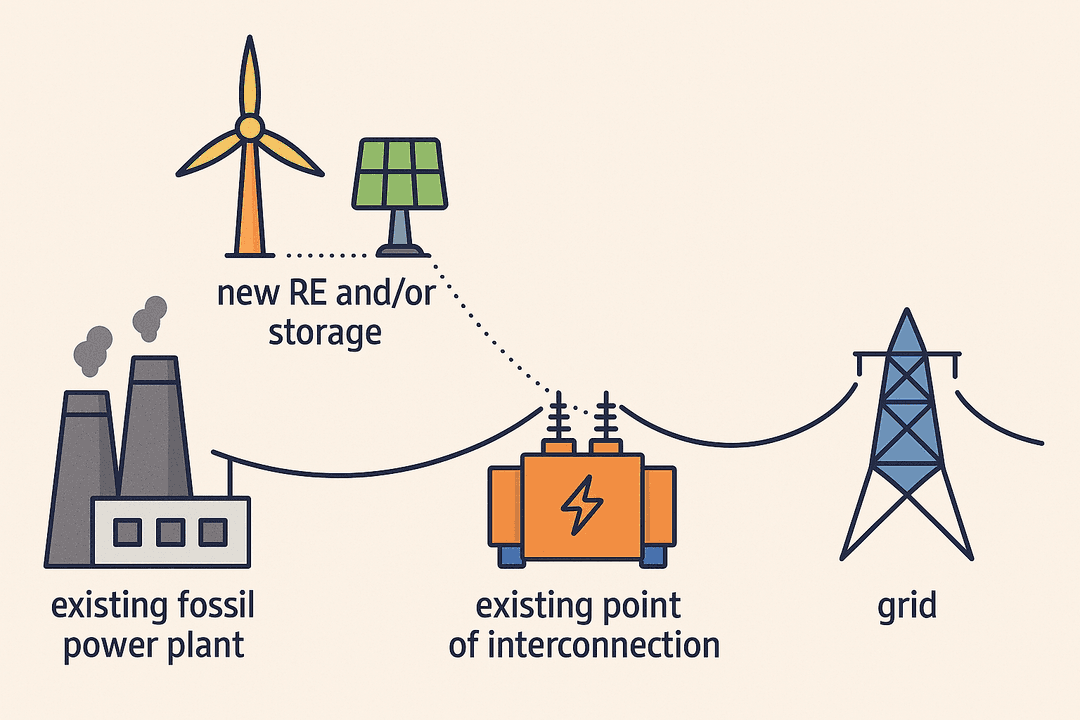
Surplus Interconnection Service allows new electricity supply resources to connect to the grid using existing infrastructure that serves already operating generators, without exceeding the total output capacity already allocated to the existing resource. FERC Order 845 (2018) cleared a regulatory pathway for generators to add new electricity resources to the grid by utilizing surplus capacity at existing interconnection points.
Key Results
Available Surplus Capacity
Virginia can add 21 GW of clean energy capacity through surplus interconnection: 12.4 GW solar + 4.1 GW wind + 4.5 GW storage. This includes 8 GW at thermal plants and 13 GW at existing renewable plants—all at existing sites without new transmission.
Cost Savings
Surplus interconnection can save $1.8 billion in interconnection costs by leveraging existing infrastructure, equivalent to $529 per Virginia household. This conservative estimate only accounts for interconnection savings—additional benefits from co-location and transmission utilization would increase total savings significantly.
Fast Deployment
Surplus interconnection projects can be completed in 12-18 months compared to 6+ years for standard queue projects. PJM's surplus process follows a streamlined study approach, enabling rapid deployment when no network upgrades are triggered.
Thermal Interconnections
Virginia has significant thermal capacity, with plants operating at less than 15% capacity factor (mostly gas peakers), leaving grid connections idle most of the time. By 2030, building new solar will be cheaper than operating existing thermal plants, even without IRA tax credits. By co-locating solar and wind at these sites, we can bypass lengthy interconnection queues and deploy clean energy using existing infrastructure.
Key Results
Abundant Local Resources
~92.7 GW PotentialOver 92.7 GW of combined solar (73.8 GW) and wind (8.9 GW) potential exists within 6 miles of Virginia's thermal plants. This enormous renewable resource can enable clean energy deployment at existing interconnection points.
Underutilized Capacity
10.7 GW at <15% CF10.7 GW of Virginia's thermal capacity (61%) operates at less than 15% capacity factor, with 68% operating below 30% CF. This leaves expensive grid infrastructure idle most of the time, creating immediate opportunities for surplus interconnection.
Economic Crossover
17.6 GW by 2030By 2030, building new solar will be cheaper than operating 17.6 GW of Virginia's existing thermal plants (100% of total thermal capacity), even without IRA tax credits. Currently, solar is already cost-competitive with 9.9 GW of thermal capacity.
Total RE Integration Potential
~8 GW by 2030Approximately 8 GW of solar can be economically integrated at Virginia thermal plants by 2030, using existing grid connections and avoiding lengthy queue delays.
Thermal Plant Portfolio
17.6 GW CapacityVirginia has 117 thermal units across 29 plants with 17.6 GW total capacity. Gas CCGT dominates at 51% (9.0 GW), followed by Gas CT at 24% (4.2 GW), Coal at 14% (2.5 GW), and Oil & Gas Steamers at 11% (1.9 GW).
Renewable Interconnections
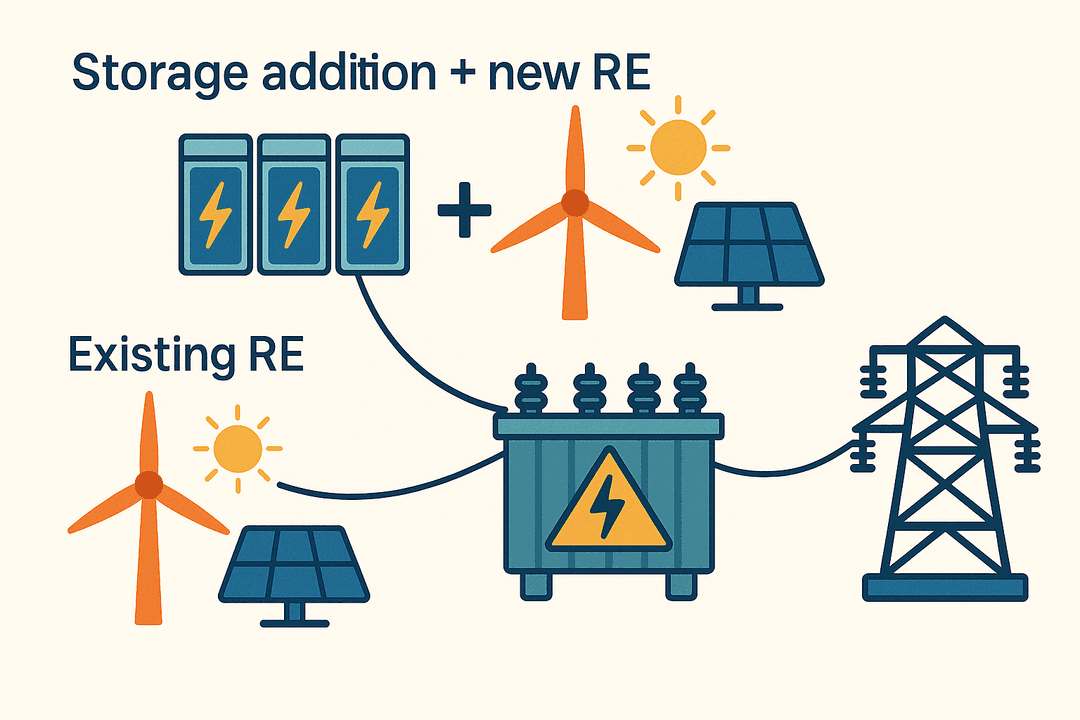
Virginia's existing renewable capacity operates at low capacity factors—meaning interconnection capacity sits idle most of the time. Adding battery storage can enable additional renewable capacity and dramatically increase capacity factors, effectively turning variable renewables into firm power resources.
Key Results
Renewable Resource Potential
~433.9 GW TotalVirginia's existing renewable sites have approximately 433.9 GW of combined solar (387.4 GW) and wind (46.5 GW) resource potential within 6 miles of existing RE plants, representing enormous opportunity for expansion.
Battery Storage Integration
~4.5 GW of 6-Hour StorageAdding approximately 4.5 GW of 6-hour battery storage at Virginia's solar sites would deliver firm, dispatchable capacity with 67% ELCC—comparable to Gas CT (61%)—helping meet peak demand and enhance grid reliability.
Additional RE Capacity
~8.5 GW EnabledVirginia's existing renewable interconnections can support an additional ~8.5 GW of renewable capacity (~4.4 GW solar + ~4.1 GW wind) when paired with battery storage, with no new grid connections required.
Maximized Utilization
~70% Average CFDeploying storage and additional renewables at existing interconnections dramatically improves capacity factors from 27% to approximately 70% on average. This transforms intermittent renewables into firm resources comparable to gas CCGT plants.